Infographics: The Visual Revolution in Content
Welcome to the world of visual storytelling! If you’re a content creator, marketer, or business owner, you’ve probably heard the buzz around infographics. These powerful visual tools are more than just pretty pictures; they’re a key component of a successful content strategy. In this comprehensive guide, we’ll dive deep into the art and science of designing infographics that captivate your audience, communicate complex information with ease, and drive real results. So, grab a cup of coffee and let’s get started on your journey to becoming an infographic master!
What Exactly is an Infographic?
Before we get into the nitty-gritty of design, let’s define what we’re talking about. The term “infographic” is a blend of “information” and “graphic.” In its simplest form, an infographic is a visual representation of information, data, or knowledge. It’s designed to present complex topics quickly and clearly, making them easier to understand and remember. Think of it as a bridge between raw data and your audience’s brain. Instead of a dense block of text or a spreadsheet full of numbers, an infographic uses charts, graphs, icons, and illustrations to tell a compelling story.

Why Are Infographics So Important?
The human brain processes visuals 60,000 times faster than text. This isn’t just a fun fact; it’s the core reason why infographics are so effective. In today’s fast-paced digital world, people are constantly bombarded with information. Our attention spans are shorter than ever, and we’re looking for content that is easy to consume. Infographics cut through the noise by delivering information in a digestible, engaging format.
Beyond the initial “wow” factor, infographics offer a host of benefits:
Enhanced Readability and Comprehension: By breaking down complex data into visual chunks, infographics make information more accessible and easier to understand.
The Anatomy of a Great Infographic
A successful infographic is a careful balance of design and content. It’s not enough to just throw some icons on a page. You need a structured approach to ensure your message is clear and impactful. Here are the key components you need to consider:
1. The Headline: This is your hook. It needs to be catchy, concise, and accurately reflect the content of your infographic. It should grab the reader’s attention and make them want to explore further.
2. The Introduction: This section sets the stage. It provides a brief overview of the topic and explains why the information is relevant to the reader.
3. The Body: This is the heart of your infographic. It’s where you present your data and information using a mix of visuals and text. The key here is to create a logical flow that guides the reader through your story.
4. The Conclusion/Call to Action (CTA): Your conclusion should summarize the key takeaways. The CTA is your opportunity to prompt the reader to take the next step, whether that’s visiting your website, downloading a guide, or sharing the infographic.
5. Citations and Sources: Credibility is crucial. Always include your sources to show that your data is well-researched and trustworthy.
The Design Process: A Step-by-Step Guide
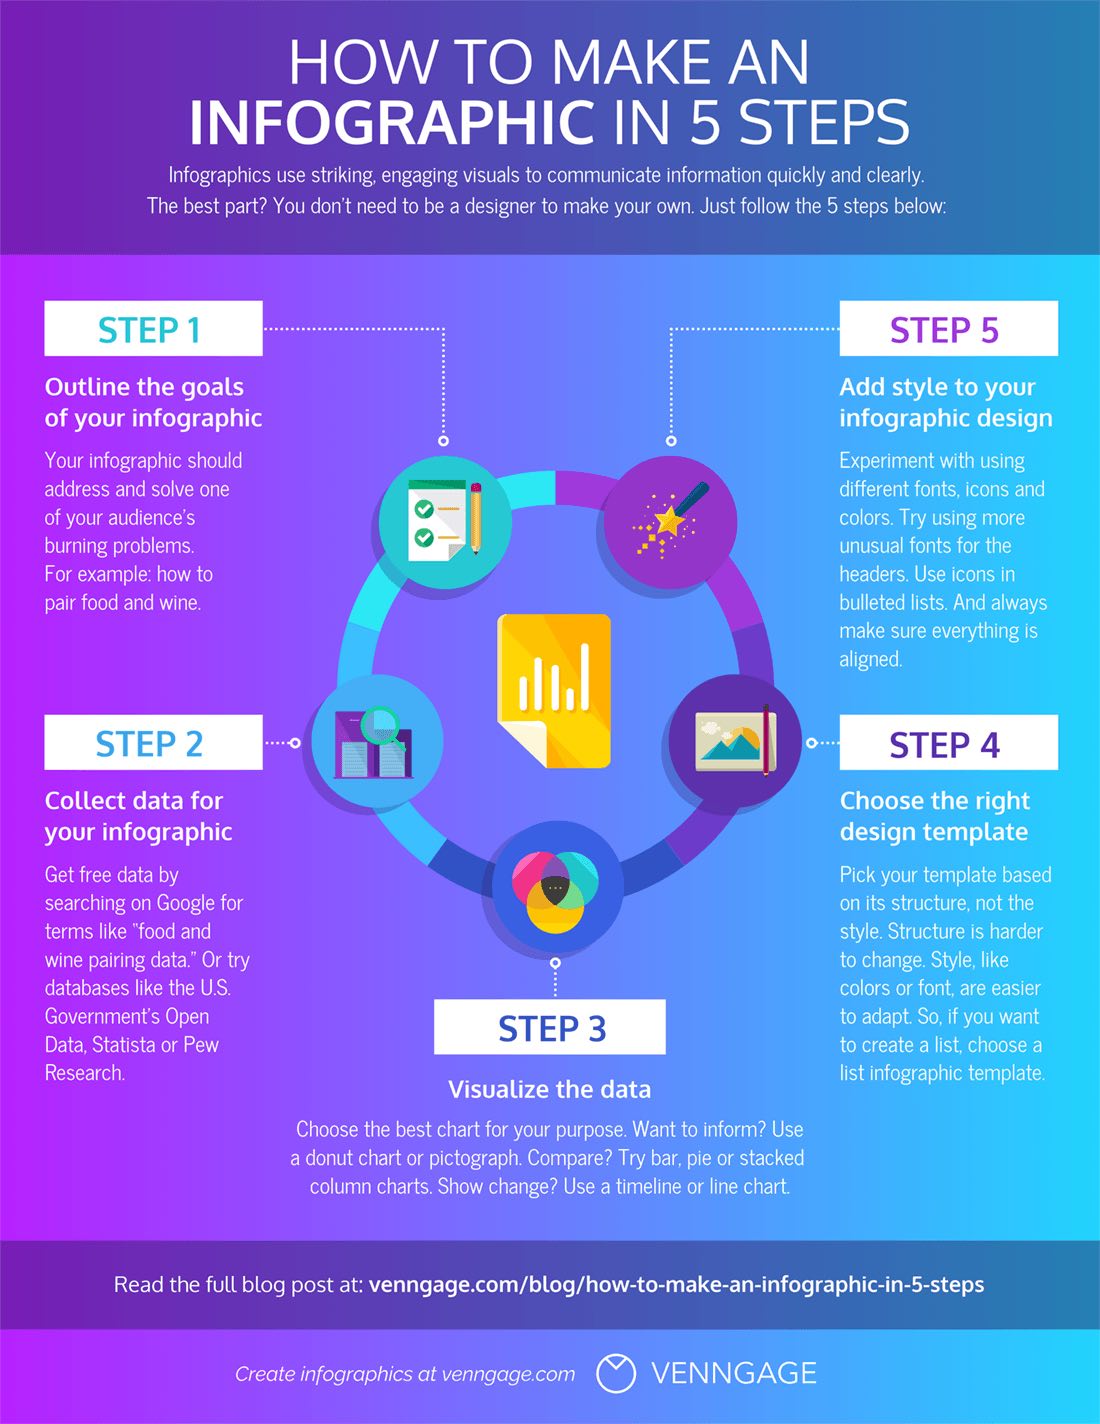
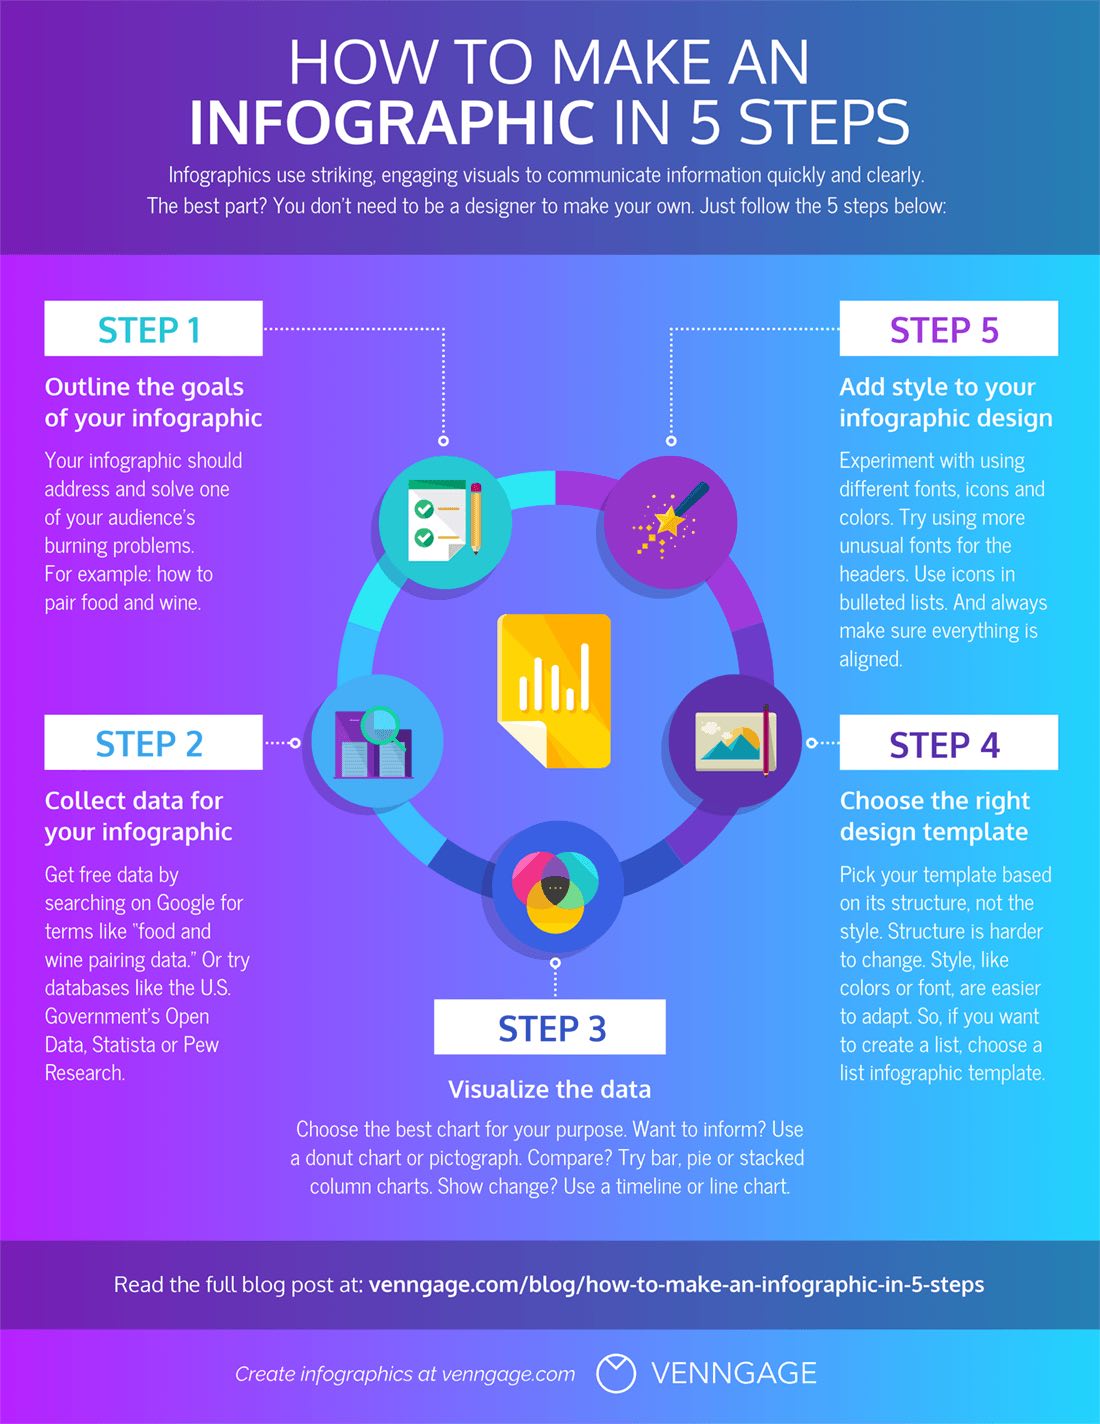
Designing a great infographic doesn’t require a degree in graphic design. With the right tools and a solid plan, anyone can create compelling visuals. Here’s a breakdown of the process:
Before you even think about colors or fonts, you need to answer two fundamental questions:
A great infographic is built on a foundation of solid data. This is where you do your research.
There’s no one-size-fits-all approach to infographics. The type you choose depends on your content and your goal. Common types include:
This is a crucial, often-skipped step. Before you open any design software, grab a pen and paper. Sketch out a rough layout of your infographic. This helps you visualize the flow of information and ensures you have enough space for all your elements. Think about:
You don’t need expensive software like Adobe Illustrator to create a great infographic. There are plenty of user-friendly, affordable, and even free options available:
This is where your infographic starts to take shape.
Now, it’s time to bring your sketch to life!
Common Pitfalls to Avoid
Even experienced designers can make mistakes. Here are some common traps to watch out for:
Information Overload: Don’t try to cram too much information into one infographic. Focus on one core topic.
The Role of Infographics in SEO
You might be thinking, “This is all great for design, but how does it help me with SEO?” That’s a fantastic question, and the answer is that infographics are a powerful SEO tool.
1. Backlinks, Backlinks, Backlinks: The primary way infographics boost your SEO is by attracting backlinks. When a website finds your infographic useful, they’ll often embed it on their own site and link back to your original source. This is a huge win for your search engine rankings.
2. Social Signals: Infographics are highly shareable. When people share your infographic on social media platforms, it generates social signals that search engines take into account.
3. Increased Time on Page: A well-designed infographic can keep users on your page longer, which signals to Google that your content is valuable.
4. Improved User Experience: Infographics make your content more engaging and easier to consume. This leads to a better user experience, which is a key ranking factor.
To maximize your infographic’s SEO potential, follow these best practices:
Final Thoughts: The Future is Visual
As the digital landscape continues to evolve, the demand for visual content will only grow. Infographics are a timeless tool that allows you to stand out from the crowd, communicate your message effectively, and build authority in your niche.
So, don’t be intimidated by the design process. Start small, experiment with different types of infographics, and most importantly, focus on creating content that is valuable and engaging for your audience. With a little practice and the right approach, you’ll be creating stunning, SEO-friendly infographics that not only look great but also drive real results for your business. Happy designing!


